

ACS712 AC Current Sensor

Application
This sensor is used to measure mains AC current draw as part of a home power usage monitor. More complete details of this application, which also includes voltage measurement, are provided on the AC Voltage sensor page.
Configuration
The ACS712 sensor comes in three variants designed to measure over different current ranges—5A, 20A & 30A. From the ACS712 datasheet, the sensitivity of the different versions of the ACS712 IC are as follows:
| Model | Sensitivity |
|---|---|
| ACS712ELCTR-05B-T | 185 milliVolts/Amp |
| ACS712ELCTR-20A-T | 100 milliVolts/Amp |
| ACS712ELCTR-30A-T | 66 milliVolts/Amp |
For my application I have used the 20A version, which, according to the ACS712 datasheet, provides an output voltage in the range 0~5V when measuring current in the range 0~20A. Something I originally overlooked, however, was the fact that these figures are invariably quoted as peak voltages, which is fine when dealing with DC voltages but when dealing with AC voltages we are invariably measuring RMS (Root Mean Square) values. There's a difference and the relationship between the two is given by the equation:
`V_(RMS) = V_(Peak)/sqrt(2) = (5V)/sqrt(2) = 3.53V`
So, when measuring AC voltages we will be working with an output in the range 0~3.53V.
The CubeCell [ASR6502] processor that has been used for this application incorporates 12-bit (0~4095) ADCs that are limited to a range of 0~2.4V, so an appropriate voltage divider is required to measure the output signal in either situation. In the present application a 100kΩ/220kΩ voltage divider will bring a 3.5VRMS signal back to 2.4VRMS.
Hardware
In the present application I use the Heltec CubeCell Dev-Board Plus, primarily because I needed at least two ADCs (the other one used for an AC voltage sensor).
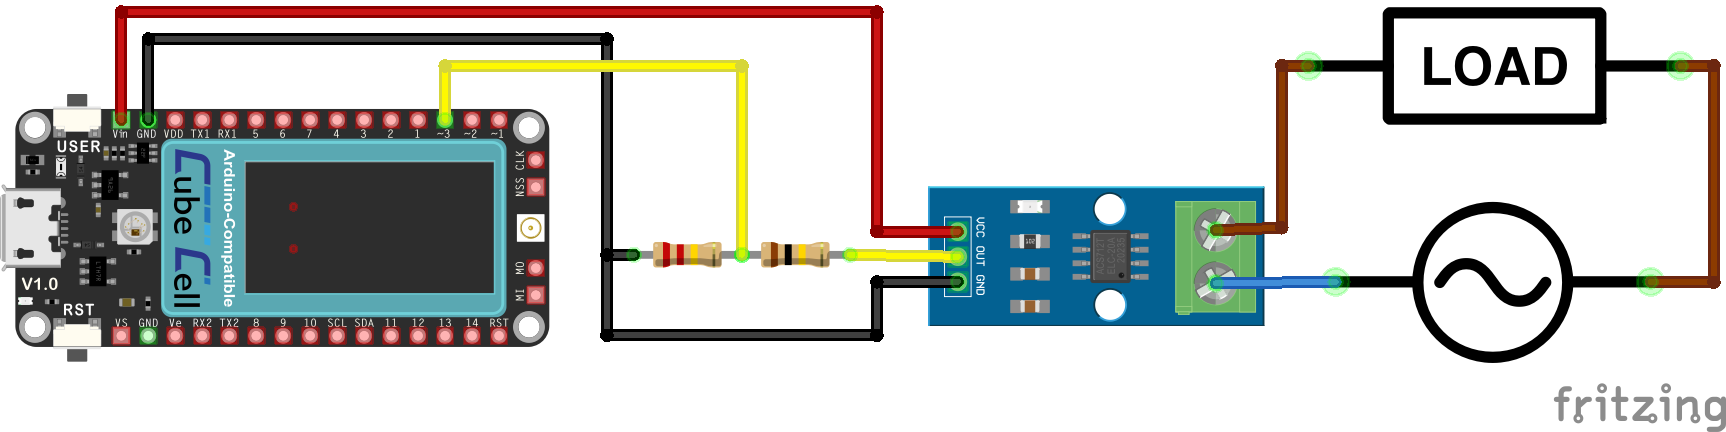
CubeCell Dev-Board Plus – ACS712 Electrical Circuit
Pin Configuration
| CubeCell Plus | ACS712 |
|---|---|
| GND | GND |
| Vin (5V) | VCC |
| ADC3 | OUT |
Note that this configuration uses a 5V supply (to power the sensor, as distinct from the supply being measured by the sensor), provided in the test environment though the USB connector on the CubeCell Plus board. I will investigate the possibility of using just a 3.3V source, and if necessary a 5V boost converter, in due course.
Software
Measurement Methodology
I've never been one to unnecessarily reinvent wheels—I've been entirely comfortable standing on the shoulders of people taller than I! In the present case, however, my usual search of the web, in this case for software required to use the ACS712 module, did not simply return what were obviously just variations on a common theme. There were examples of the use of several different ACS712 libraries (ElectroRush, miliohm & Tillaart), the Filters library and examples that didn't use libraries at all. After testing a number of these options, and noting significant variations in the results, it became apparent that I was going to have to make more of an effort to understand the basic principles involved in order to understand why these different approaches produced different results.
Once again, there are any number of educational websites that discuss the measurement of AC voltage or current but I found this one, from Electronics Tutorials, to provide a both clear and simple explanation of the theory underpinning what were essentially the two approaches used by most of the alternatives I had tested. The difference between the two is simply that some implementations assume a perfectly sinusoidal waveform to simplify calculations while others recognise the fact that the waveform will rarely be perfect and take this into account.
The Root Mean Square (RMS) value for a perfectly sinusoidal waveform can be calculated quite simply from the peak or maximum value using the equation:
`I_(RMS) = I_(Peak)/sqrt(2) = I_(Peak) times 0.7071`
The more general means of calculating the RMS value of an alternating waveform, however, involves taking the square Root of the Mean of the Squares of a series of measurements taken across at least one period of the waveform:
`I_(RMS) = sqrt((sum_(i=1)^n I_i^2)/n)`
This latter method is the one used, one way or another, in all of the ACS712 libraries that I tested. All of these libraries use the same process and yield the same results in the present environment. The difference between the implementations is primarily in how the various inputs are specified, but this is really just a question of convenience.
Just for the record, the following were the sources of the various methods that I tested:
- Arduino Project Hub / SurtrTech
- DeepBlueMbedded
- ElectroRush4u
- Instructables
- Makerguides
- miliohm
- Rob Tillaart
- seeed studio
I settled on using the Tillaart ACS712 library, which can be loaded through the Arduino IDE Library Manager, in my application because it appears to be better supported and more comprehensive than the others, although I have not used any feature that is not available in all three of the ACS712 libraries mentioned. I found the Filters library a little more fiddly to set up although it too ultimately uses the same formula to calculate the sensed current.
Environment Parameters
Because we are measuring current indirectly, there are several environment-specific variables that must be set and fed into our calculations, notably:
- The characteristics of the power supply being measured. Knowing the frequency of the input signal allows us to determine the time period over which we must take measurements in order to sample the entire waveform
In Australia, the domestic supply voltage is a nominal 230 volts with a frequency of 50Hz.
- The sensitivity of this sensor, that being the relationship between the current being measured and the signal voltage output
In the present case, this is the ACS712ELCTR-20A-T, with a sensitivity of 100mV/A
- The resolution of the ADC being used to measure the signal voltage
For the CubeCell Plus (ASR6502) that we are using, this is 12 bits, or 4095
- The input voltage range of the ADC to which the sensor is connected
For the CubeCell Plus (ASR6502) that we are using, this is 2.4V
- The values of the resistors used in any voltage divider required to bring the sensor's signal voltage, or at least the range of the sensor's signal voltage within which measurements are to be made, back within the range of that of the ADC
In the present case we will be using a 100kΩ/220kΩ voltage divider to bring the 0~3.5VRMS range of the sensor signal back within the 0~2.4V range of the ASR6502 ADC
I used a PowerTech Plus MS6108 power meter to cross-check the readings obtained by the various implementations. This is by no means a fancy piece of equipment and I have no idea how accurate it might be but, if nothing else, it provided a consistent reference.
I then used three settings on a small fan/heater to assess the accuracy of measurements:
- Fan Only: 0.15 Amp
- Fan + Heat Low: 3.84 Amp
- Fan + Heat High: 7.20 Amp
Using the following test sketch, all measurements were in agreement with the power meter within ~1%.
|
Power Monitor Application
The Power Monitor application sketch can be downloaded by clicking on the link below. The EEPROMHandler and PacketHandler libraries can be downloaded from their respective downloads pages and the CubeCell Plus pin definition file from the CubeCell Platform page. I'll provide a complete description of what's going on at some point, but for the time being you'll need to look at the descriptions under each of the relevant sensors to see what's happening in each case.

|
Power Monitor Node (place holder only) | ?-Jan-2026 | [TBA KB] |
The reader may also need to refer to the section on LoRa configuration.
Place the Power Meter Node sketch folder in the Arduino IDE root folder (Arduino). If running on a Heltec CubeCell Plus module, as is currently configured, this sketch also requires a current version of the Heltec [CubeCell] hardware support libraries.