

ZMPT101B AC Voltage Sensor

Application
This sensor is used to measure mains AC voltage as part of a LoRa-based home power usage monitor. There are plenty of inexpensive power monitors on the market, but their output is invariably only displayed on a local LCD panel. I wanted a monitor that would report data to a remote host, where it could be collected an analysed. In my rural environment, a WiFi option was also too restrictive.
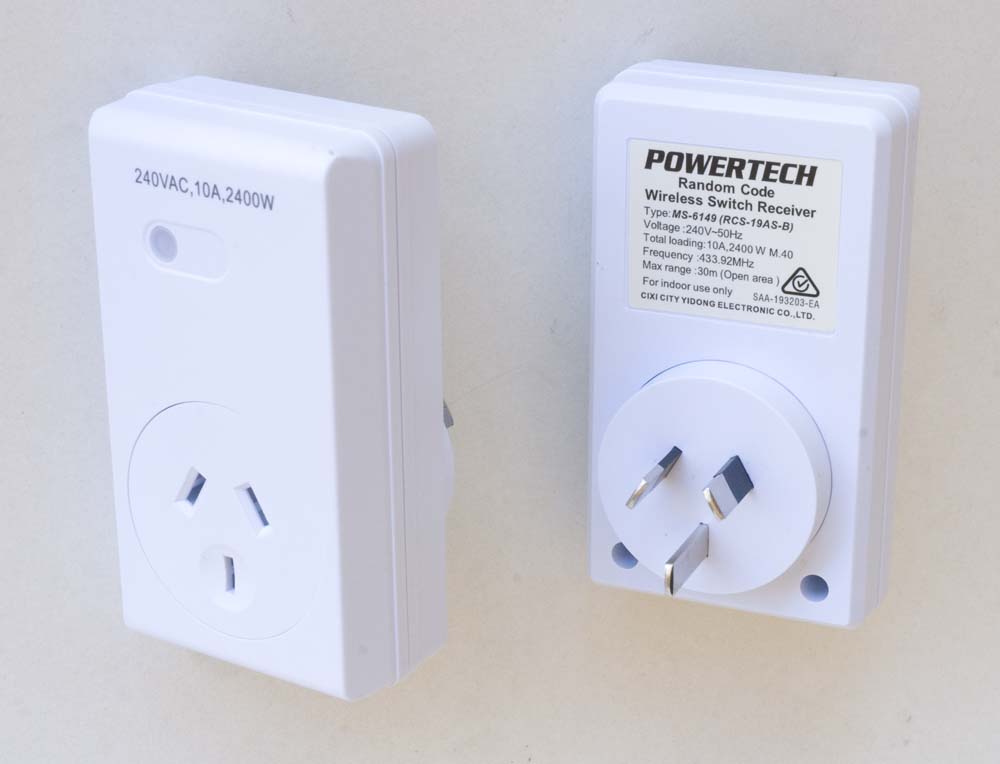
The main challenge I faced in the present application was finding a suitable power plug/socket arrangement into which to insert the voltage and current sensors. I ultimately discovered a PowerTech Wireless Switch Receiver that provided exactly what I needed, and a bit more that I didn't need, for ~A$10. While that's somewhat more than I'd like to be paying for a project enclosure, the bit that was important was the plug/socket arrangement. For its original application, a wireless switch was inserted between the plug and the socket. For the present application, the wireless switch circuitry was removed and replaced with voltage and current sensors. The [LoRa-enabled] host processor was housed externally—not ideal but, for the purpose of prototyping, workable.
| External | Internal |
|---|---|
 |
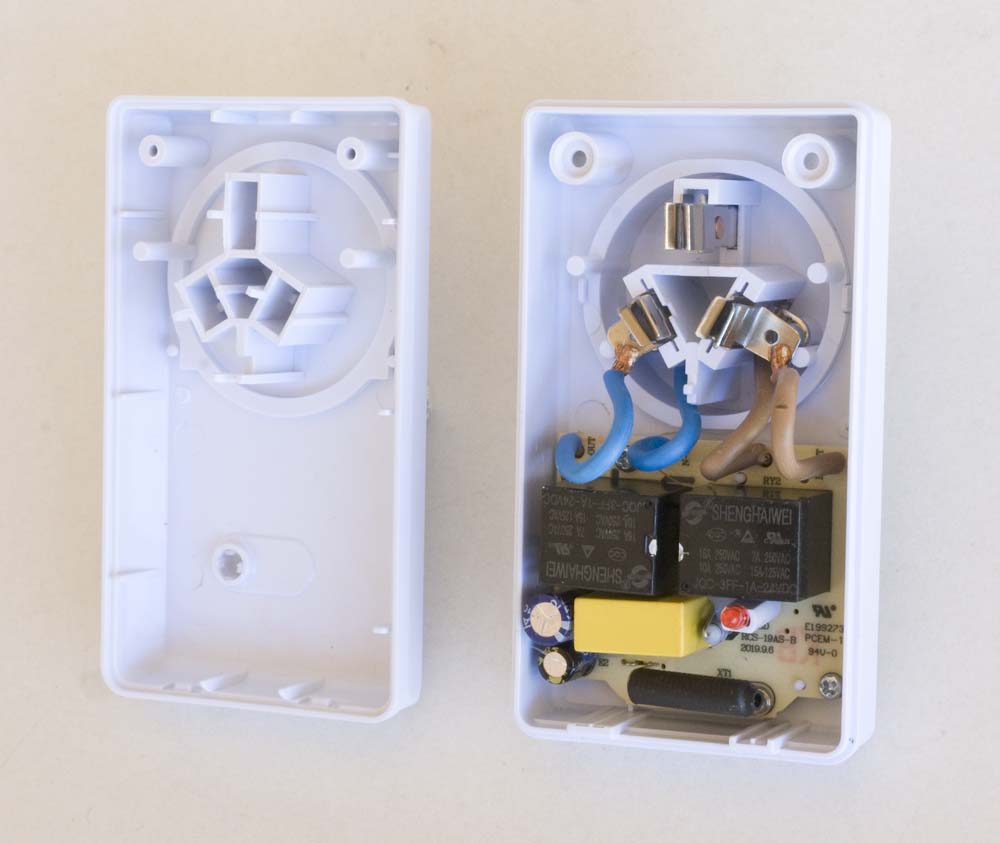 |
PowerTech Wireless Switch Receiver
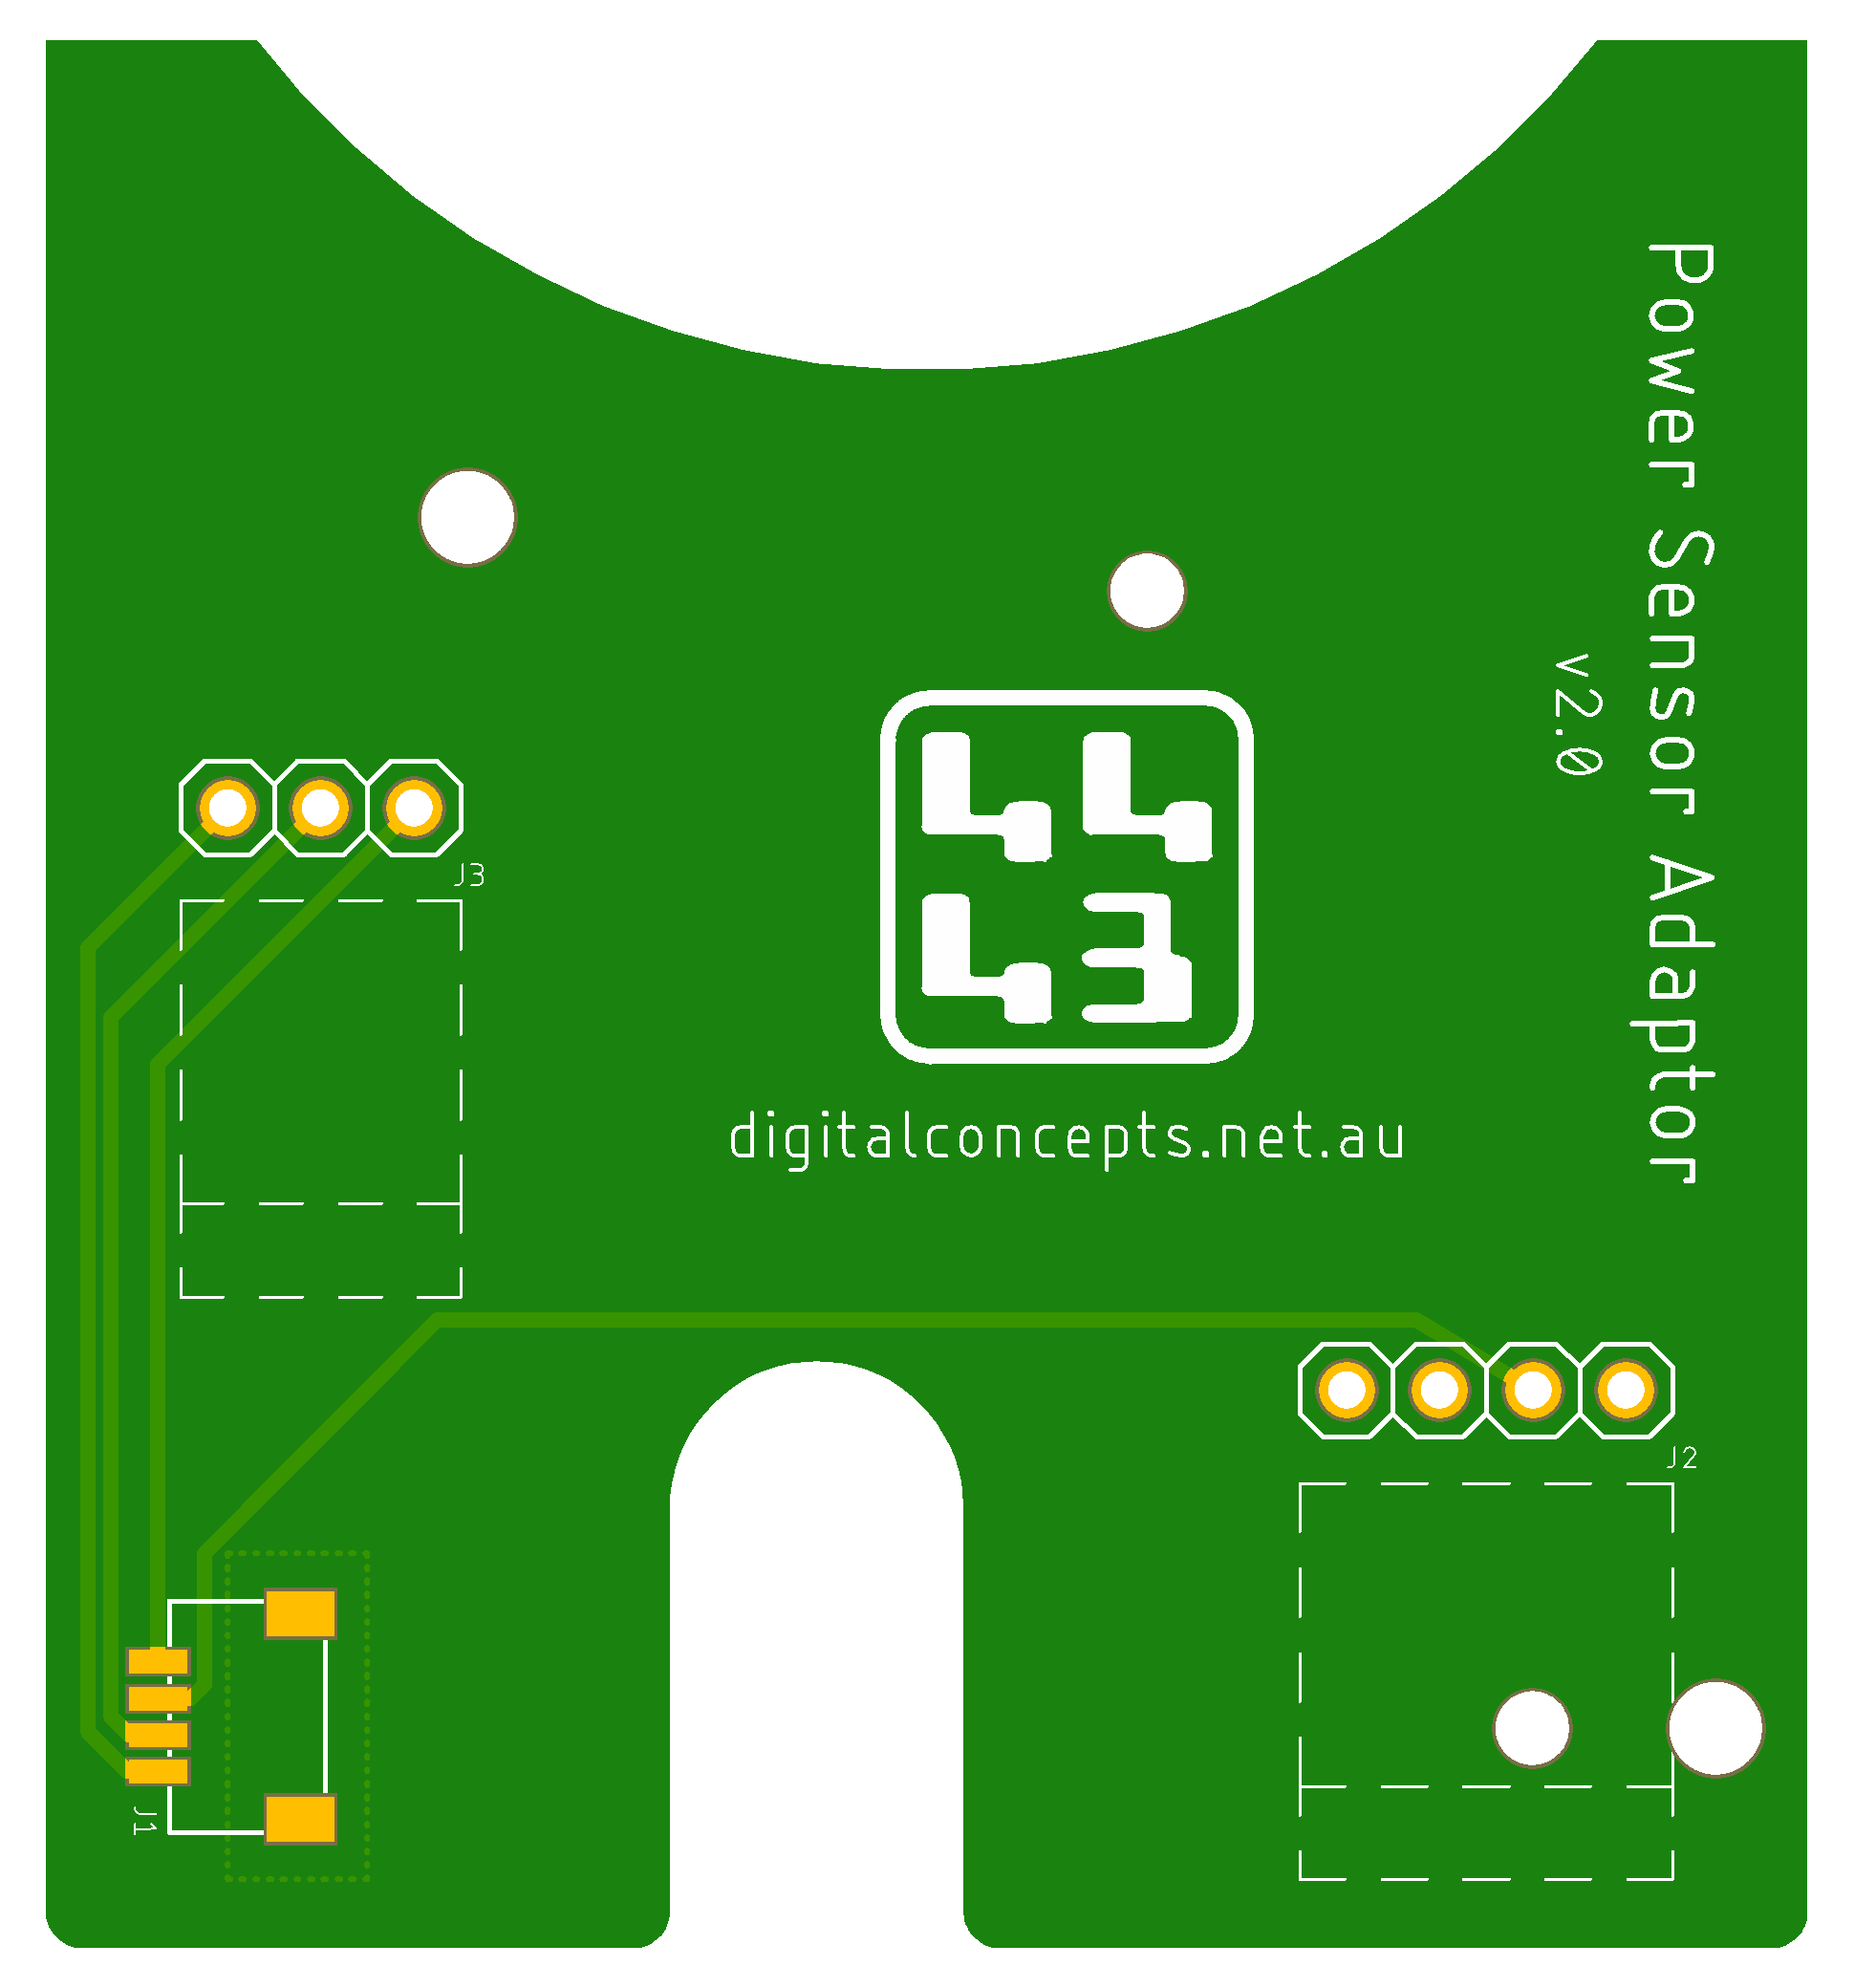
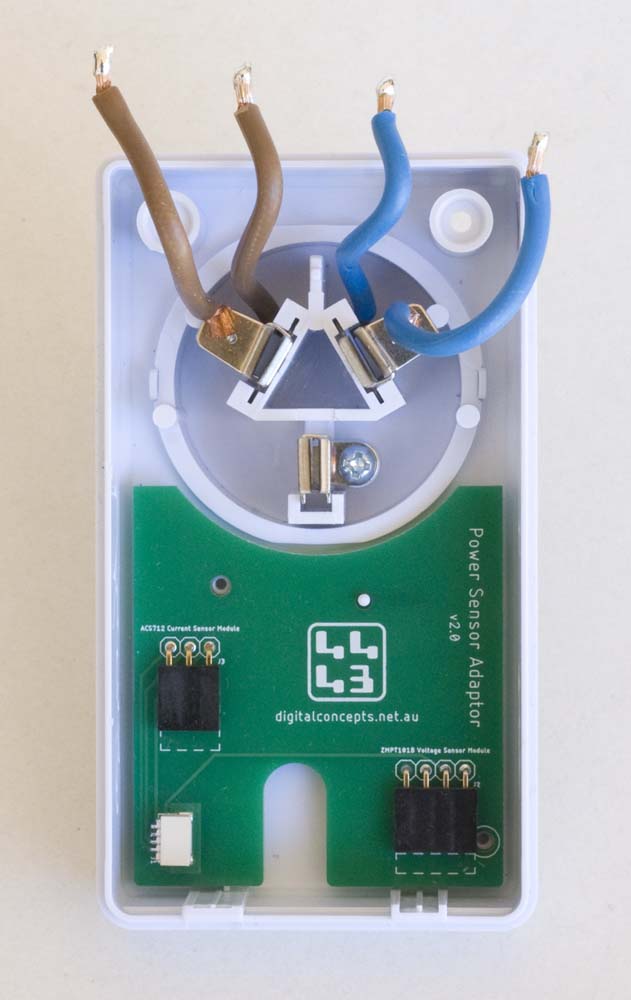
For ease of implementation, in the first instance at least, off-the-shelf ZMPT101B AC voltage and ACS712 AC current sensor modules were used and a custom PCB designed to support the two sensor modules inside the enclosure—the PowerTech 'enclosure' neatly accommodates this arrangement.
| Top | Bottom |
|---|---|
 |
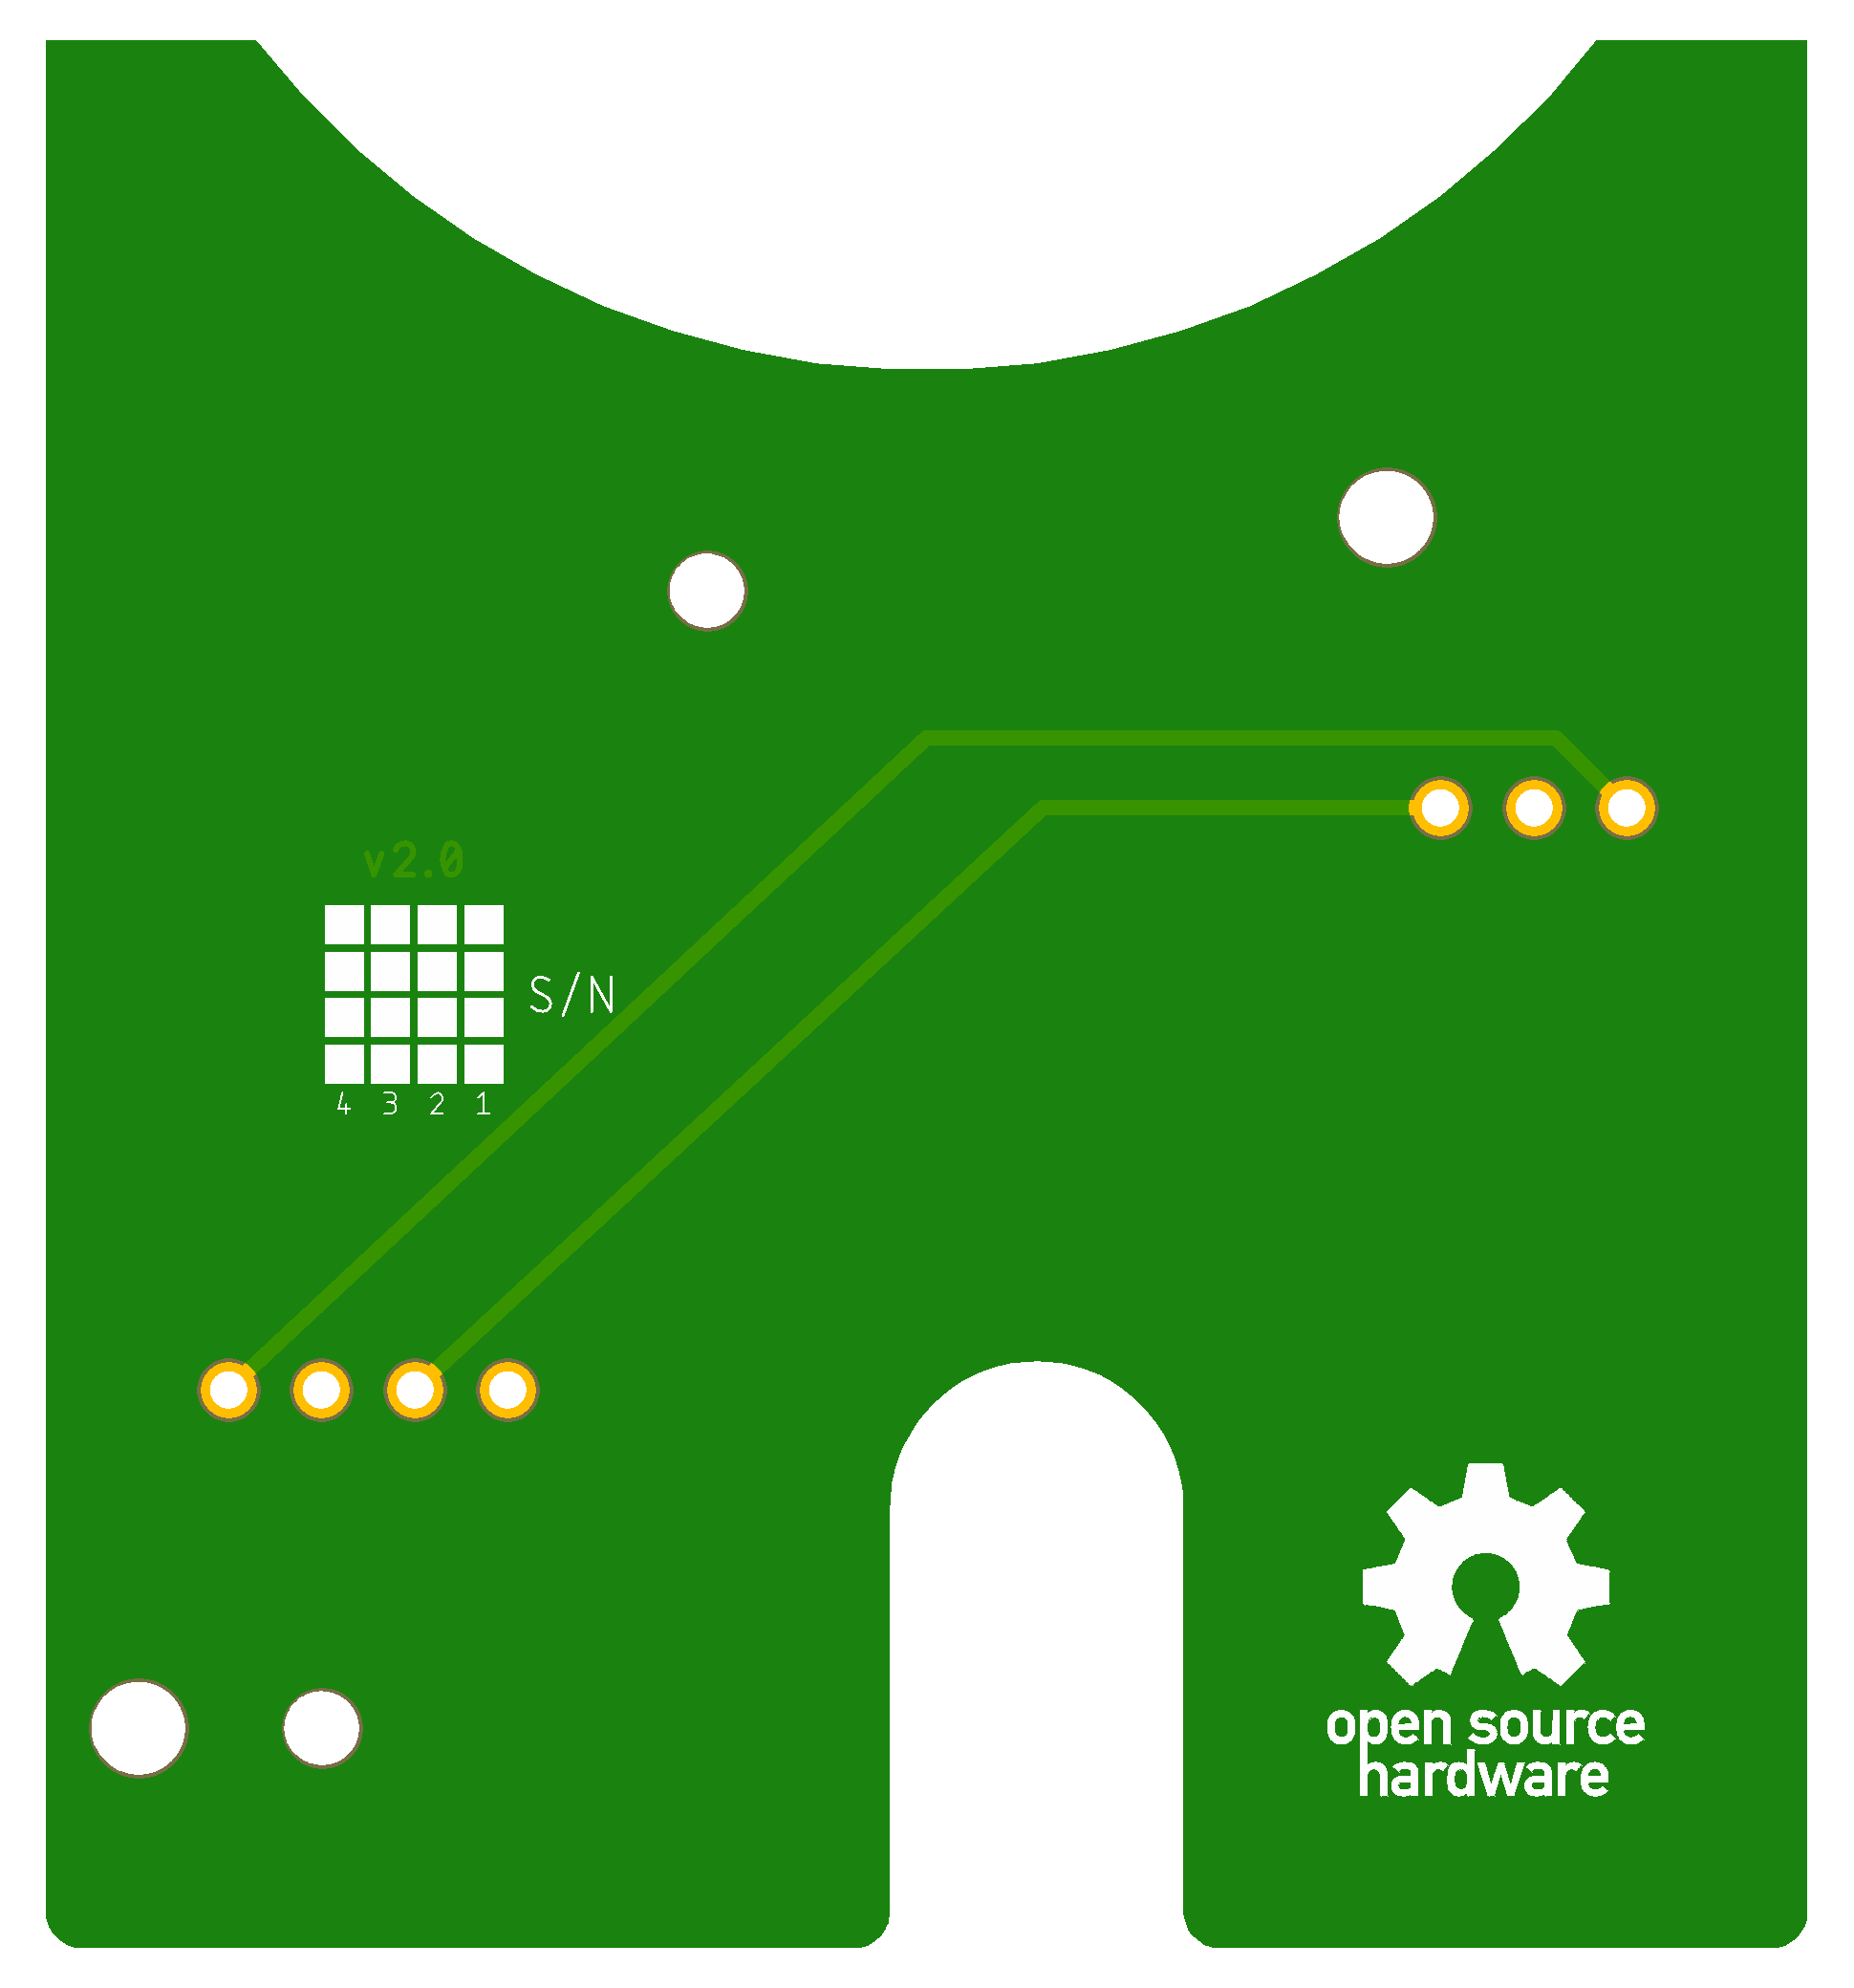 |
PT-SA PCB
See here for CAD and CAM files.

|
PT-SA Eagle CAD Files | [34 KB] |
|
|
PT-SA CAM Files | [82 KB] |
When fitting the PCB into the enclosure, there are two points to note. First, the two plastic locator pins protrude through the respective holes in the PCB. The one located under the [4P] ZMPT101B module header must be trimmed back to the level of the PCB so as not to interfere with the header. The second is that, while the PCB includes two mounting screw holes, the ZMPT101B module must be in place when the PCB is inserted into the enclosure. This obstructs one of the holes, so there is no way to actually use this mounting point and the PCB must be held in place by the single [M2.3 × 4mm] screw in the unobstructed mount point.
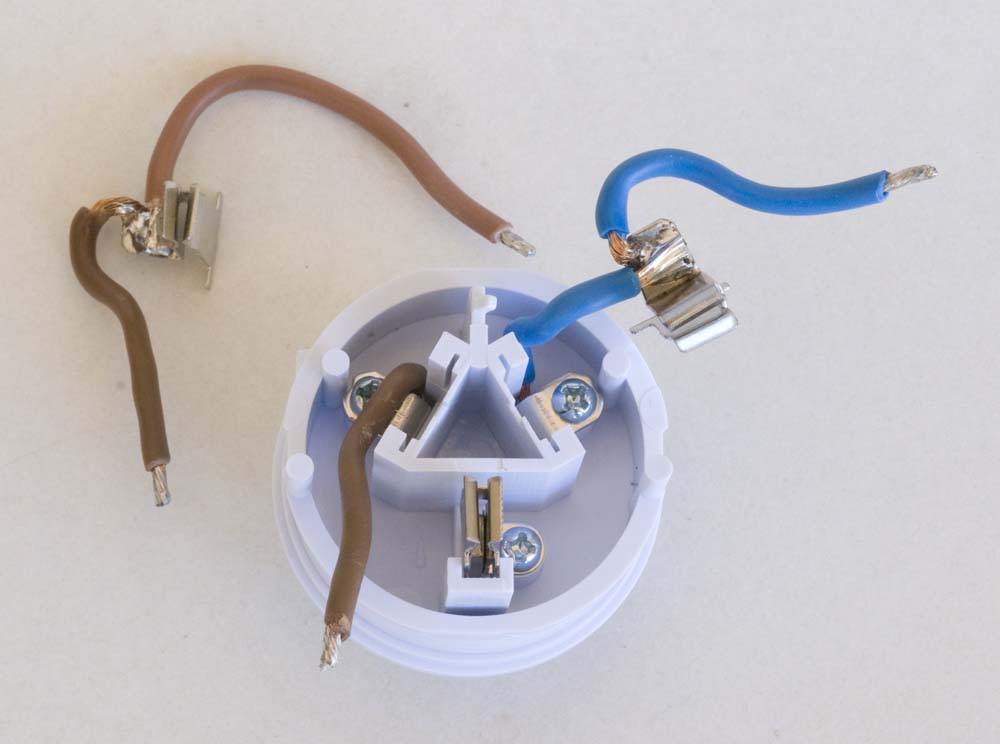
There is some additional cabling required on the socket. An additional [brown] cable is required on the active pin, to connect to the ZMPT101B module. The [blue] neutral wire from the plug (the bottom wire) then needs to be soldered to the corresponding socket connector. These cables can also be shortened as required to fit neatly into the enclosure when connected to the sensors. The modifications and the final arrangement are illustrated in the images below.
I also rotated the socket pins 180° so that the MCU cable would exit from the bottom of the enclosure when the monitor was plugged into a conventionally oriented socket outlet—in Australia, by convention, the earth pin is located at the bottom of a socket.
 |
  |
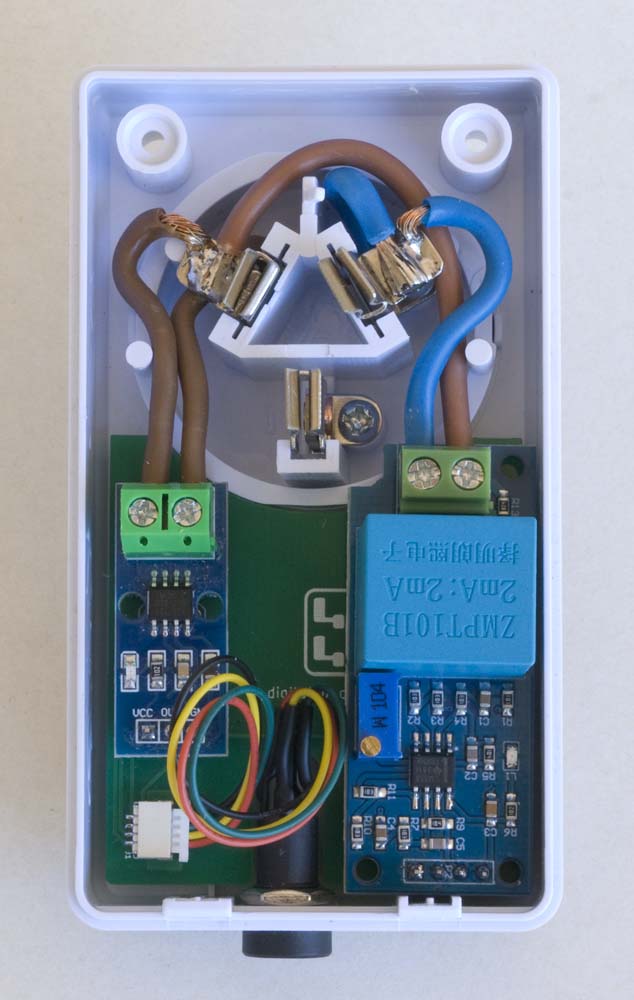 |
Power Monitor Internal Arrangement
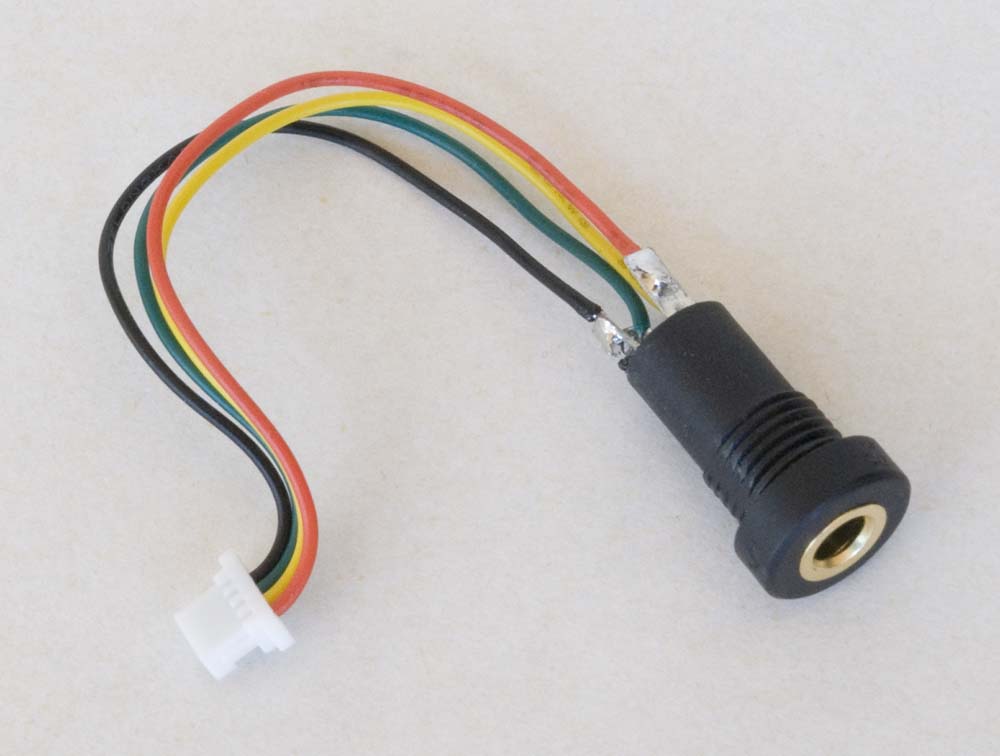
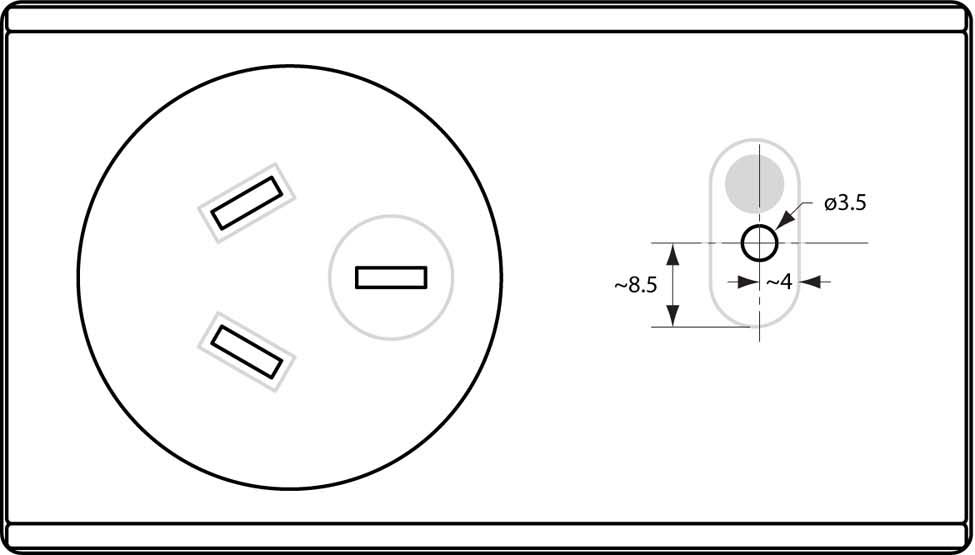
Given the space restrictions within the enclosure, a 4P audio jack arrangement, rather than my usual WEIPU waterproof connectors, was then used for the host processor connection. Given that the power socket itself is only intended for internal applications, this was not seen as a major problem. The audio jack socket has two flat sides so that, if inserted into an appropriately fashioned hole, it will not turn in the hole. If this is the desired outcome, a 7mm hole should be drilled, the sides filed flat and the 'non-flat' sides filed out further to accommodate the (5/32") socket. If it's not critical that the socket be locked in place, and in the present application it's not, a 5/32" (~8mm) hole can simply be drilled—the socket will be held in place by its nut in either case.
| Trimpot Access | Audio Jack (MCU Connect) |
|---|---|
 |
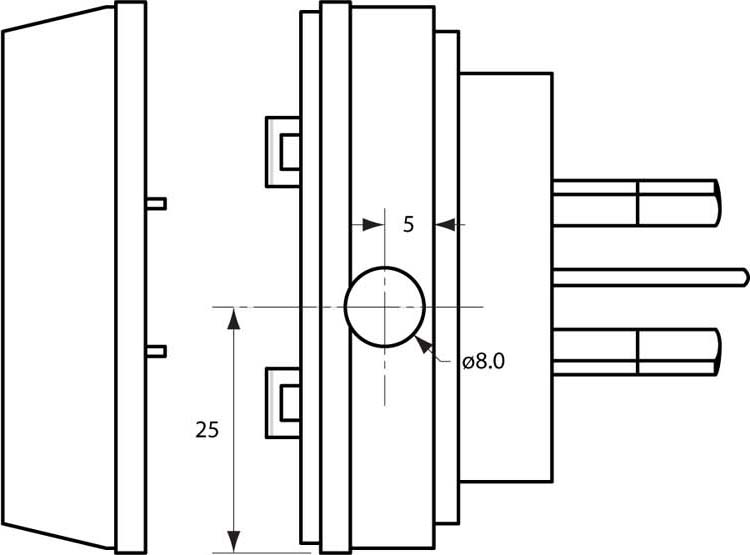 |
Enclosure Hole Locations
It is not a real problem how the audio jack is wired, as long as the wiring sequence is the same on both the sensor and host sockets. While more general usage of an audio jack would have the bottom ring connected to ground, in the present application it would seem safer to have the bottom ring connected to the supply voltage (the red wire in the illustration below). This way, the only connection ever made by the supply voltage on the plug would be with the corresponding [last] ring on the socket, and then only when the plug was fully inserted. Using the tip or any other ring for the supply voltage would present the opportunity for the supply voltage to contact one of the other connectors as the plug is inserted. I'm not sure that this would be a problem in the present application but there's no harm in being safe.
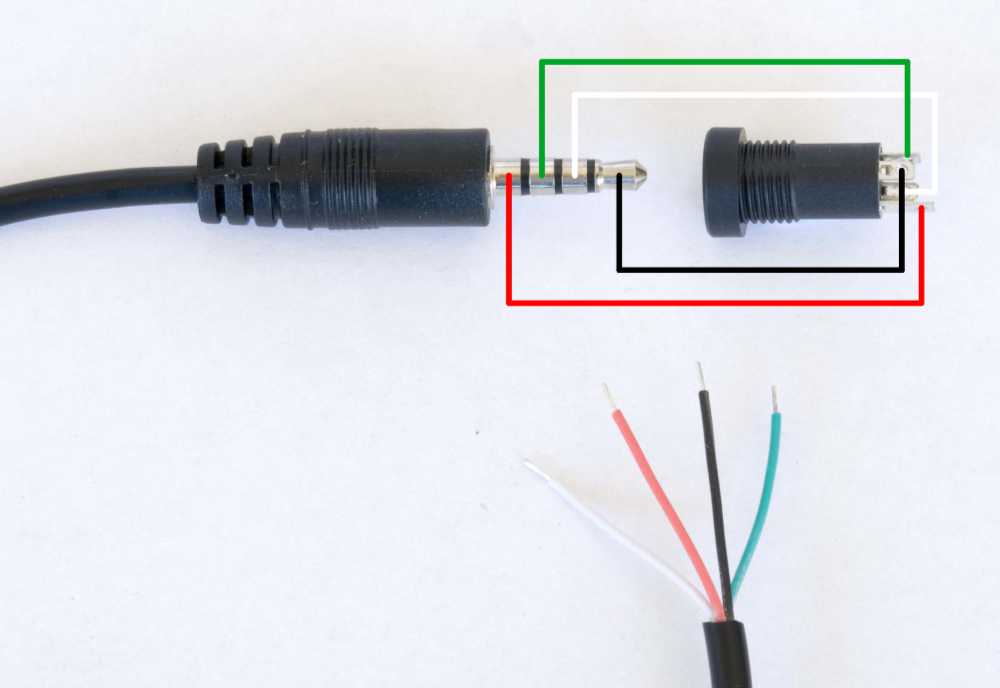 |
4-Pole Audio Jack Wiring
It is generally recommended that the cable between analog sensors and the host procesor be shielded and as short as possible to avoid unwanted noise.
The final modification, a 3.5mm hole providing access to the sensor module trimpot, as illustrated above and in the photo below, simplifies the process of calibrating the ZMPT101B sensor module. Despite my best intentions, I've never managed to get the hole in exactly the right place (the trimpot is never really in exactly the same place on different modules in any case), so the hole invariably needs to be filed out a little.
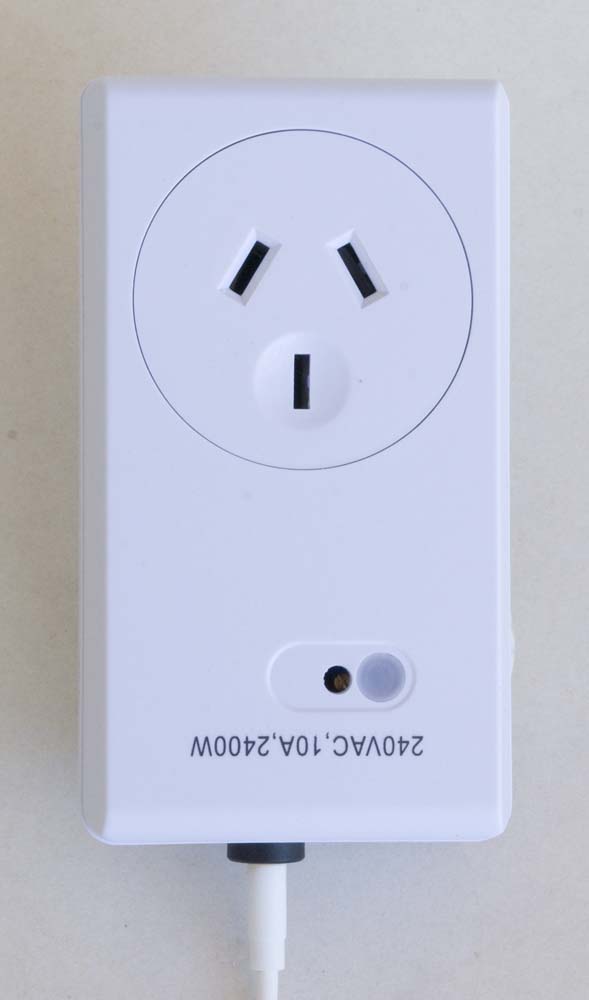 |
Power Monitor Sensor (Assembled))
Configuration
The ZMPT101B sensor module is used to measure AC voltage in the range 0~250V, yielding a directly correlated output, through an onboard LM358 dual OpAmp, in the range 0~5V when operating on a 5V supply (more generally, 0~Vcc where Vcc is the OpAmp supply voltage). Since the output follows the input, and the input is an AC voltage, the output signal oscillates about the midpoint in this range, ~2.5V. A further consideration, however, is the fact that the range indicated is the peak voltage range while we will invariably be measuring the RMS voltage. As such, the maximum measured voltage will be:
`V_(RMS) = V_(Peak)/sqrt(2) = (5V)/sqrt(2) = 3.53V`
The following links provide some related information for anyone interested.
General information on the ZMPT101B module
Warning re input resistor rating
Technical detail on signal distortion
Hardware
In the present application I use the Heltec CubeCell Dev-Board Plus, primarily because I needed at least two ADCs (the other one used for an AC current sensor).
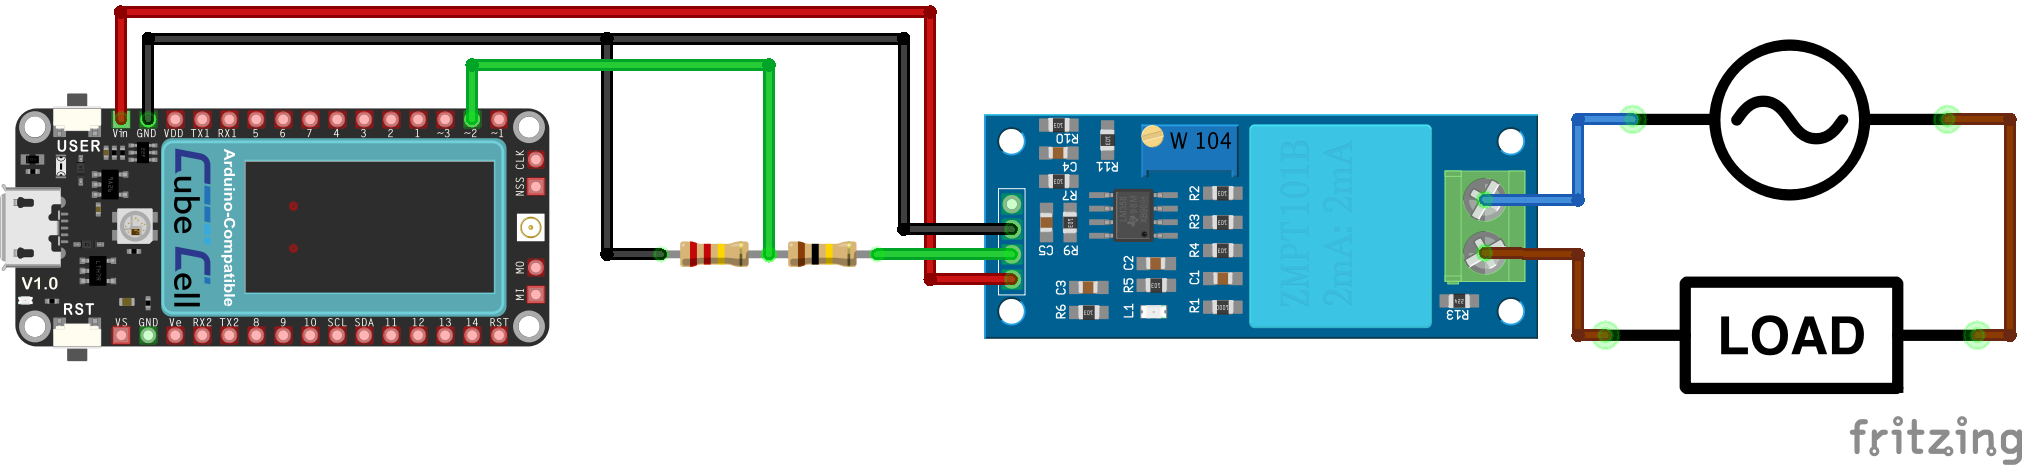
CubeCell Dev-Board Plus – ZMPT101B Electrical Circuit
Pin Configuration
| CubeCell Plus | ZMPT101B |
|---|---|
| GND | GND |
| Vin (5V) | VCC |
| ADC2 | OUT |
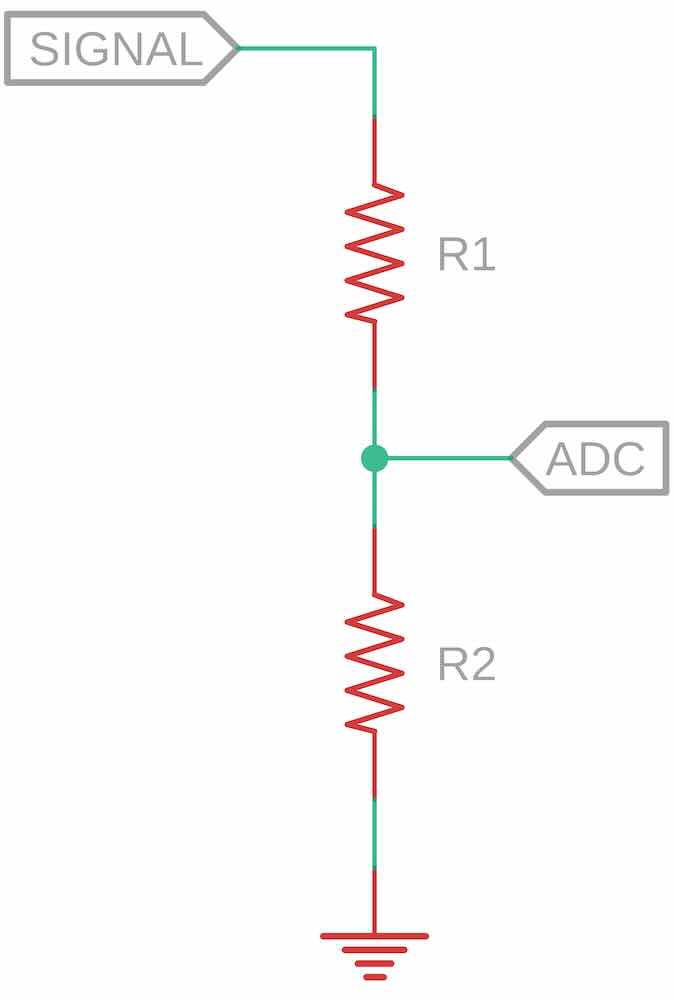
The CubeCell Plus [ASR6502] module used in this example includes 12-bit (0~4095) ADCs but they are limited to a range of 0~2.4V. A voltage divider is therefore required to step down the ZMPT101B module output signal voltage before being fed into the ASR6502 ADC.
I ran tests using three different voltage divider configurations with the following results:
| R1 | 100Ω | 200Ω | 200Ω |
|---|---|---|---|
| R2 | 220Ω | 330Ω | 220Ω |
| Vpeak Vin = 5V |
3.4V | 3.1V | 2.6V |
| VRMS Vin = 3.53V |
2.4V | 2.2V | 1.8V |
| ADCmax | ~4000 | ~3500 | ~3000 |
| ADCmid | ~2870 | ~2500 | ~2140 |
| ADCmin | ~1740 | ~1500 | ~1280 |
As noted above, the voltage level that we need to consider when measuring an AC voltage is VRMS. As a result, the optimal configuration in the present case is the 100Ω/220Ω configuration, which brings the maximum value of VRMS down to 2.4V. The signal range can then be further adjusted using the trimpot, which adjusts the gain in the LM358 dual OpAmp, on the ZMPT101B module—turn the knob on the trimpot clockwise to reduce the signal level, to eliminate any signal clipping, or anticlockwise to increase the signal level, to maximise the range and resolution of the ADC.
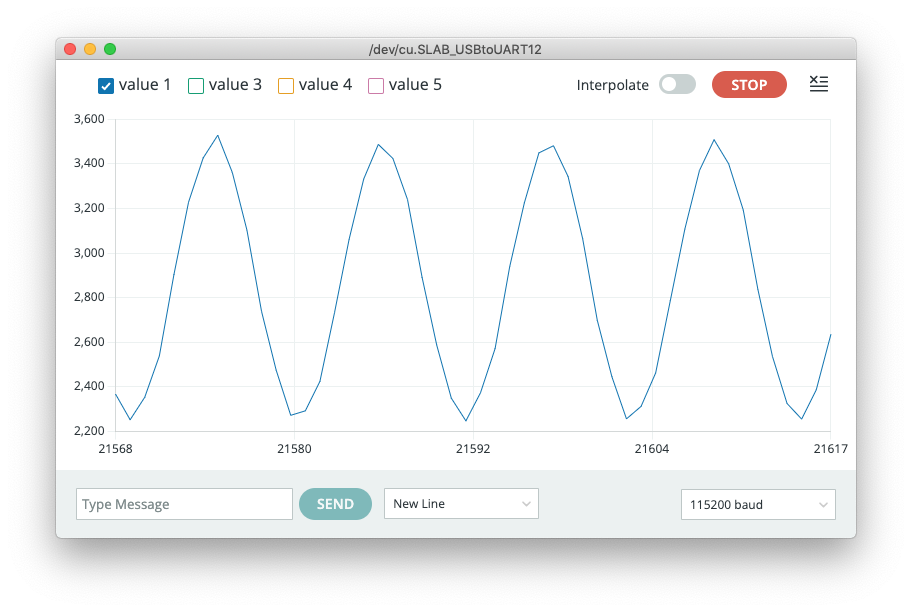
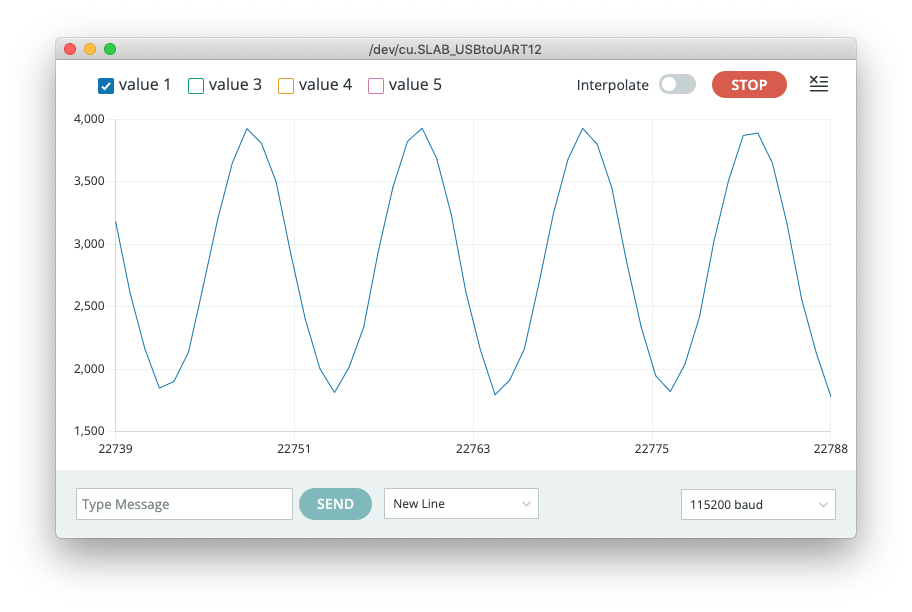
The following simple calibration sketch was used to establish the appropriate settings, by first noting the input signal range, then by adjusting the trimpot and observing the results (see below) in the Arduino IDE Serial Plotter window.
|
| Sub-optimal Range | Optimal Range | Clipping |
|---|---|---|
 |
 |
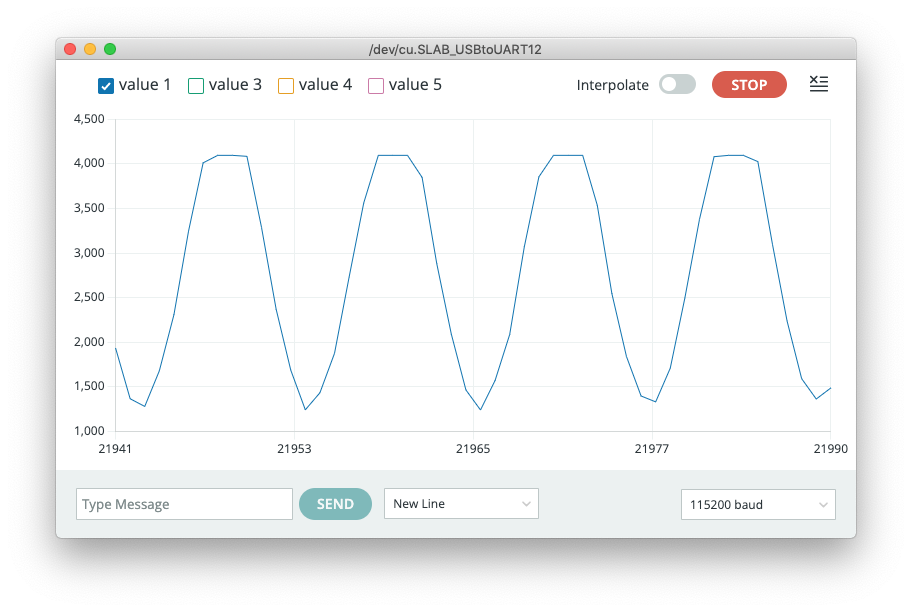 |
Arduino IDE Serial Plotter Output (100Ω/220Ω voltage divider)
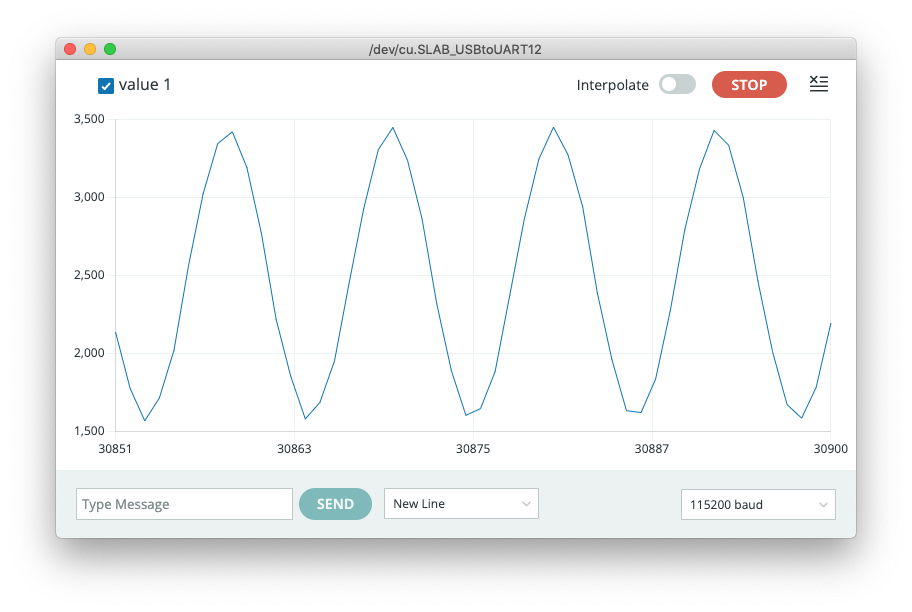
Note that, while at first it might appear that the observed high level clipping is due to overloading the ADC, it is actually a function of the LM358 dual OpAmp on the ZMPT101B module. As illustrated below, for the case where the maximum signal voltage is only 2.2V, clipping occurs well below the [4095] limit of the ADC but at the same OpAmp trimpot setting.
| Reduced Range | Reduced Range Clipping | |
|---|---|---|
 |
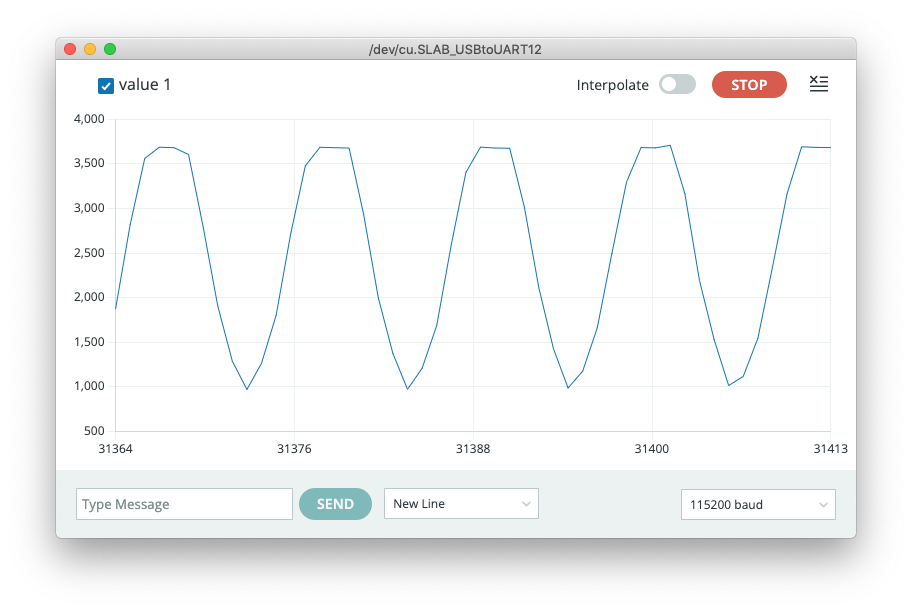 |
Arduino IDE Serial Plotter Output (200Ω/330Ω voltage divider)
Whatever voltage divider configuration is used, the the OpAmp trimpot on the ZMPT100B module needs to be adjusted so that there is no output signal clipping.
Software
A modified version of the Abdurraiq Bachmid ZMPT101B library available through the Arduino IDE Library Manager has been used in the present exercise. The modifications include the addition of a constructor and method that use the same parameter structure as those used in the Tillaart library for the ACS712 sensor, making the code required when using the two sensors together more logical and easier to understand. Until these amendments are incorporated into the library available through the Library Manager, the modified library can be downloaded from my GitHub repo.
Environment Parameters
There are several environment-specific variables that must be set and fed into our calculations, notably:
- The characteristics of the power supply being measured. Knowing the frequency of the input signal allows us to determine the time period over which we must take measurements in order to sample the entire waveform
In Australia, the domestic supply voltage is a nominal 230 volts with a frequency of 50Hz.
- The sensitivity of this sensor, that being the relationship between the voltage being measured and the signal voltage output
For the ZMPT101B module, the sensitivity can be tuned using the onboard trimpot. As a result, there is no fixed sensitivity value that can be fed into calculations. In the present case, the sensitivity must be determined by an appropriate method such that the voltage measured at the module output matches a known input value (see below).
- The resolution of the ADC being used to measure the signal voltage
For the CubeCell Plus (ASR6502) that we are using, this is 12 bits, or 4095
- The input voltage range of the ADC to which the sensor is connected
For the CubeCell Plus (ASR6502) that we are using, this is 2.4V
- The values of the resistors used in any voltage divider required to bring the sensor's signal voltage, or at least the range of the sensor's signal voltage within which measurements are to be made, back within the range of that of the ADC
In the present case we will be using a 100kΩ/220kΩ voltage divider to bring the 0~3.5VRMS range of the sensor signal back within the 0~2.4V range of the ASR6502 ADC
Determining the Module Sensitivity
As noted above, the relationship between the input voltage and the signal voltage generated by the ZMPT101B module is largely a function of the LM358 dual OpAmp configuration. This will vary with the the setting of the onboard trimpot and must therefore be determined for any individual module after the relevant trimpot has been set.
The ZMPT101B library includes an example sketch [calibrate.ino] that steps sequentially though sensitivity settings until the output signal voltage calculation matches the nominated value of the input voltage. The result of this exercise is the value to which the variable zmptSensitivity should be set, at least initially. It can be refined further if required to achieve the desired correlation between the supply voltage and that returned by the library method.
This approach, however, is not all that practical if we want to deploy several power meters based on a single software image. In this case, we need a fixed software configuration, with any necessary calibration being a function of the hardware setup. The way this has been achieved in the present case is to calibrate one sensor as described, to determine a reasonable sensitivity setting to be hard coded into the software image, then adjust the trimpot on individual sensors to calibrate them against a known voltage.
Without having a nice bench power supply that I could use to generate a specific voltage for calibration purposes, I once again simply used a PowerTech Plus MS6108 power meter and the existing mains voltage.
This still doesn't really account for any variation between processor ADCs, but these sensors are not exactly 'industrial grade' in the first place and there is a degree of variation within the measurement methodology we are using in any case.
The following test sketch is based on the modified ZMPT101B library described above.
|
Power Monitor Application
The Power Monitor application sketch can be downloaded by clicking on the link below. The EEPROMHandler and PacketHandler libraries can be downloaded from their respective downloads pages and the CubeCell Plus pin definition file from the CubeCell Platform page. I'll provide a complete description of what's going on at some point, but for the time being you'll need to look at the descriptions under each of the relevant sensors to see what's happening in each case.
|
|
Power Monitor Node (place holder only) | ?-Jan-2026 | [TBA KB] |
The reader may also need to refer to the section on LoRa configuration.
Place the Power Meter Node sketch folder in the Arduino IDE root folder (Arduino). If running on a Heltec CubeCell Plus module, as is currently configured, this sketch also requires a current version of the Heltec [CubeCell] hardware support libraries.